Monitoring Cloud
AWS CloudWatch provides a powerful set of tools for monitoring a software system running on AWS. With AWS CloudWatch you can:
- Collect and track CloudWatch metrics – variables that measure the behavior of your system
- Configure CloudWatch alarms to notify operations or take other automated steps when potential problems arise
- Monitor, store, and search CloudWatch logs across all your AWS resources
- Create CloudWatch dashboards that provide a single overview for monitoring your systems
Datomic is fully integrated with all of these AWS monitoring tools. On the producing side, Datomic creates metrics and logs; and on the consuming side, Datomic organizes metrics in custom dashboards. This document shows how to manage and monitor your Datomic system.
Topics
Searching CloudWatch Logs
CLI Tool
The CLI Tools allow you to list log messages and show detail for specific messages without necessitating a trip to the AWS console.
AWS Console
If you need to view the CloudWatch Logs for a Datomic system:
- Open the CloudWatch Logs in the AWS Console
- Click on the Log Group named "datomic-{System}", where System is your system name
Each EC2 instance will create a separate log stream. Usually, you will want to search across all log streams:
- Click the "Search Log Group" button
- Click to the right of the filter box to choose an appropriate time window
- Enter a metric filter pattern to scope your search
Finding Alerts
The search pattern "Alert - Alerts" will find the text of every alert produced by Datomic. The "Alert" matches each alert, and the "- Alerts" filters redundant summary messages.
The example below demonstrates reviewing a week's worth of alerts. The single event that matches is a transient DynamoDB request failure, so not a problem.
Finding Logs by Message
CLI Tool
The CLI Tools allow you to list logs between a starting time --tod and some minutes in the past --minutes-back.
The datomic log list command can be piped to grep with the -B 1 option to be used to find specific logs for a given time period:
datomic log list my-datomic-system \
-f all --tod 2019-06-24T03:41:23.491 --minutes-back 150 \
| grep -B 1 CloudWatchMetrics
The preceding command will find all logs labeled "CloudWatchMetrics" from March 6th, 2019, 1:11:23.491am until March 6th, 2019, 3:41:23.491am.
AWS Console
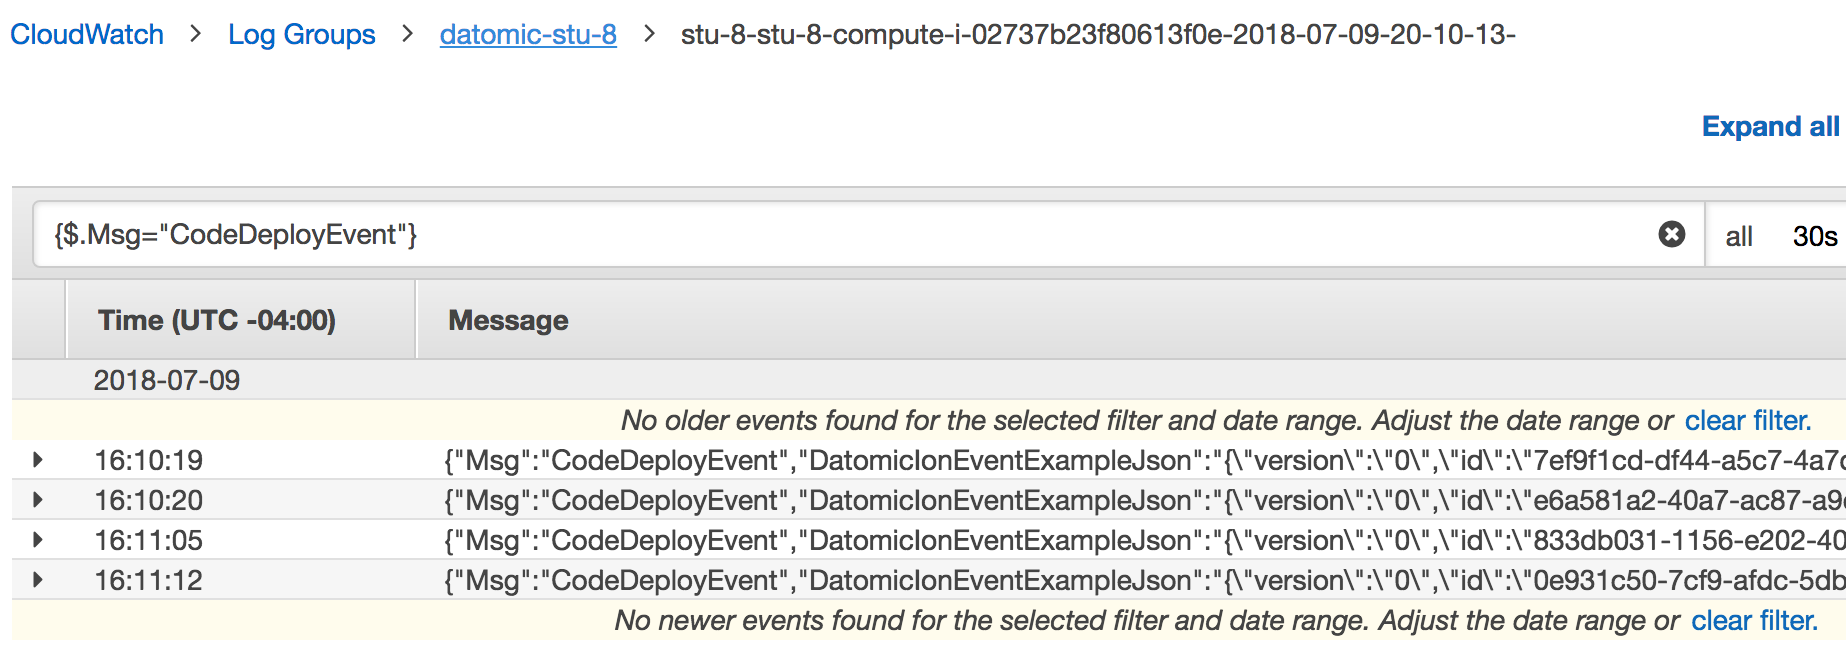
The image below shows using the CloudWatch
filter and pattern syntax to find all logs whose Msg is
"CodeDeployEvent".
- The brackets
{}identify the query as a JSON metric filter - The
$is a placeholder for log entry as a whole - The dot syntax scopes the search to the individual key
Msg
Metrics Produced by Datomic Cloud
Datomic compute nodes publish Cloudwatch Metrics as follows:
- Namespace is DatomicCloud
- Dimensions are your system name and your compute stack name
Datomic reports a large number of distinct metrics, many of which are useful primarily for Datomic support. The most useful metrics for operators fall into three categories:
- Troubleshooting metrics are helpful for troubleshooting problems
- Request metrics measure the request load on a system, and can act as autoscaling triggers for query groups
- Capacity metrics measure the size of the database and indexes, and are helpful in sizing your primary compute group
These key metrics are summarized below.
| Metric | Category | Units | Description |
|---|---|---|---|
| Alerts | Troubleshooting | Count | Number of alerts written to Cloudwatch logs |
| JvmFreeMb | Troubleshooting | Mb | Free JVM memory |
| HttpDirectOpsPending | Request | Count | Total number of HTTP direct requests started |
| HttpDirectThrottled | Request | Count | HTTP requests rejected because server too busy |
| HttpEndpointOpsPending | Request | Count | Total number of client requests started |
| HttpEndpointThrottled | Request | Count | Client requests rejected because server too busy |
| Datoms | Capacity | Count | Number of datoms in a database |
| IndexMemMb | Capacity | Mb | Total size of the in-memory indexes on a node |
| NodeDbCount | Capacity | Count | Number of databases being served by node |
Logs Produced by Datomic Cloud
Datomic writes Cloudwatch Logs as follows:
- The "Log Group" name is the name of the Datomic system
- Each EC instance will create a log stream named by the convention {system}-{group}-{instance-id}-{timestamp}
Datomic Cloud Dashboards
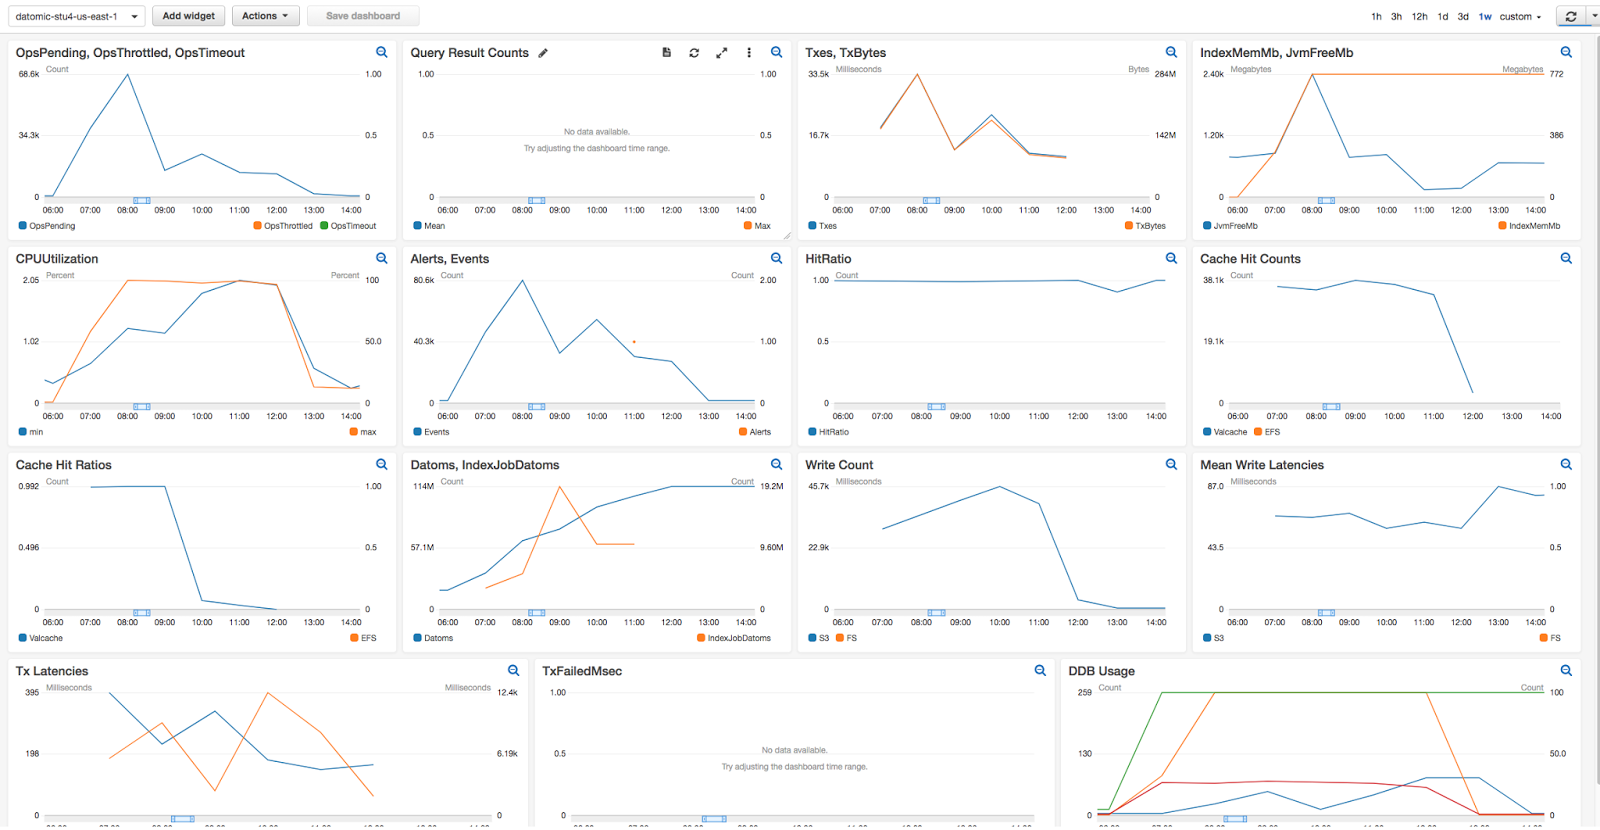
When you launch a compute group, it automatically creates a dashboard
named datomic-(name)-(region) that you can view in the AWS
Console.
The primary compute stack creates a large dashboard, suitable for viewing on a large ops monitor screen:
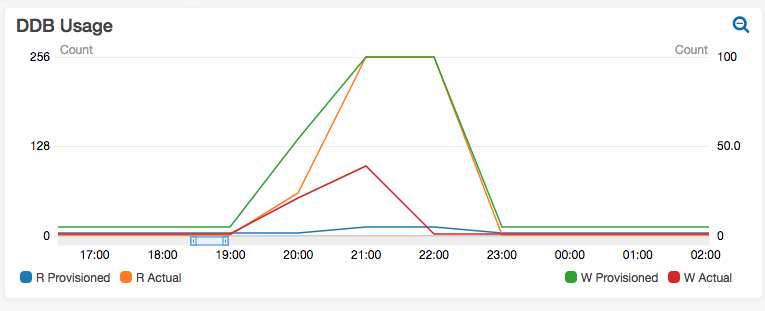
Each dashboard widget tells a story. For example, the DynamoDB Usage widget tracks DynamoDB AutoScaling of reads (left axis) and writes (right axis). In the image below you can see DynamoDB write provisioning (the green line) scaling up for a four-hour period during a batch load, and then scaling back down to almost nothing.
A query group stack creates a dashboard that is a subset of the information shown for a primary compute group.


